
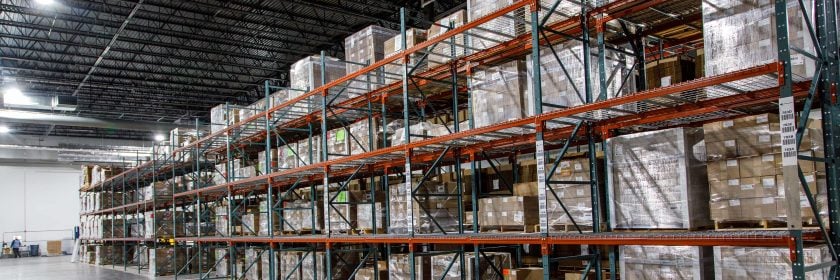
Advanced warehouse optimization simulations and DES can empower logistics managers to make data-driven inventory decisions and improve warehouse efficiency.
Read More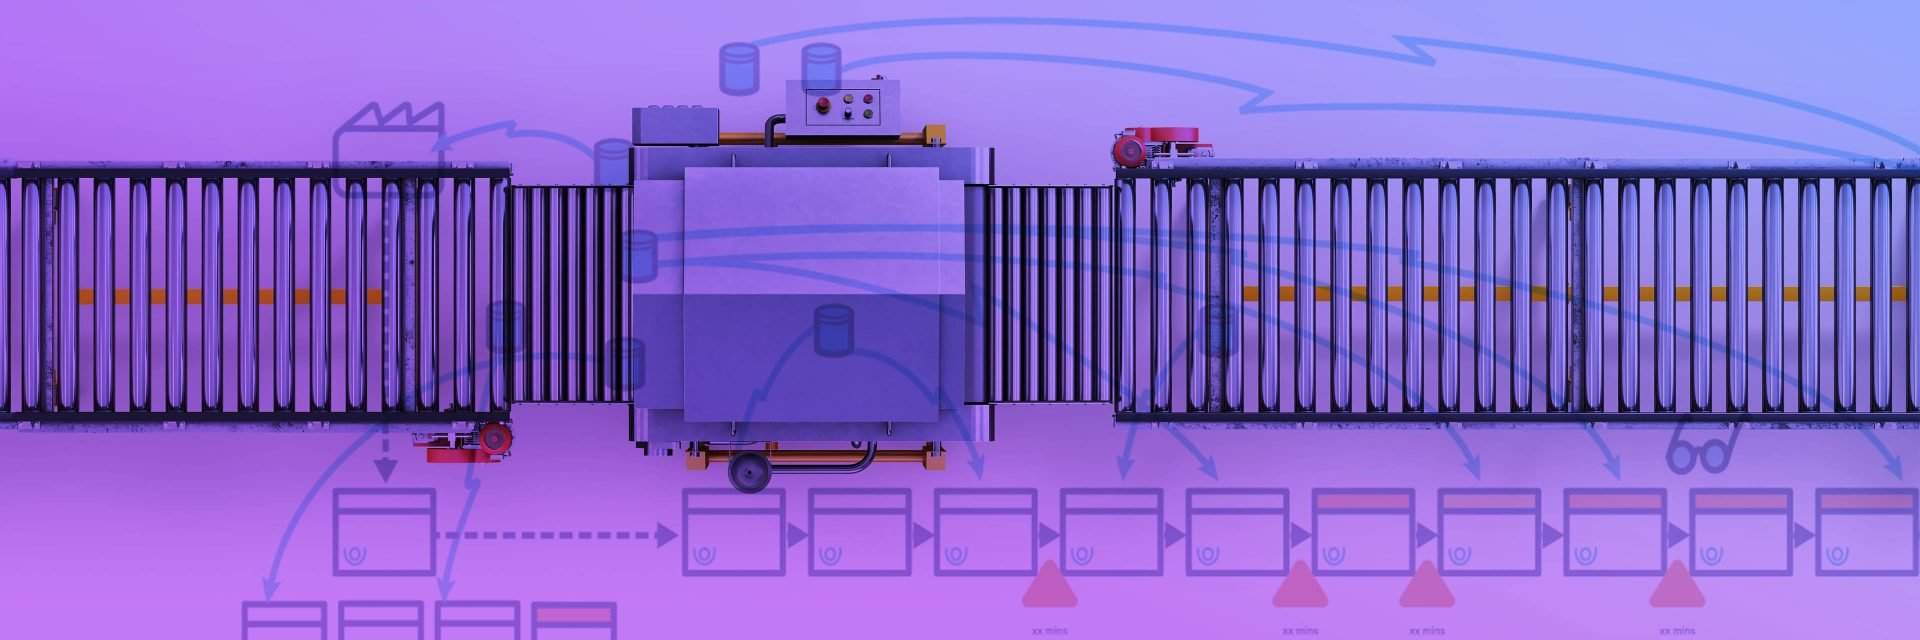
Even with smaller budgets, there are ways to enhance manufacturing operations and boost production, quality, and speed. Here’s your guide to getting there, along with several value stream map examples.
While developed for manufacturing, organizations across every industry now turn to value stream maps to understand, measure, and improve processes and workflows. From material handling to standard operating procedures (SOPs) that govern quality testing, invoicing and expense tracking, efficiency is always essential. This article will help you understand the role, benefits, and steps of value stream mapping and how it can be applied to your operations through real-world examples.
What is value stream mapping?
Value stream mapping, or VSM, is a lean tool that helps manufacturers and other organizations visualize a specific process and identify non-value-added tasks, production bottlenecks and other problems within that process, and rapidly develop solutions to address those problem areas and drive continuous improvement. The diagram captures key flows—work, materials and information—and in doing so, VSMs help identify and eliminate wasted time, effort, materials, and spending.
The “value” part of the value stream mapping process is in its potential to give organizations not just an accurate snapshot of an existing process (whether that process is manufacturing, construction-related, or otherwise) but also a snapshot of what that process could be. A current state vs. a future state. This leads organizations to identify areas where even small adjustments could have a significant impact on process outcomes, such as throughput, quality, and speed to market, all while respecting the constraints of time and budget.
Skip ahead to examples of value stream maps in action:
The result is a roadmap leading from today’s bottlenecks and process complexities to tomorrow’s simpler, leaner, more streamlined operation.
Value stream mapping deliverables
- Current state value stream map, which depicts an existing process (such as release testing or packaging), including its unit operations and associated flow of information.
- Intermediate future state value stream map, sometimes called the “attainable” future state VSM, this shows the potential outcome of optimizing the existing process using available resources.
- Ideal future state value stream map, sometimes called the “aspirational” future state VSM, this shows what could be possible outside the constraints of time or budgetary considerations. This VSM can help manufacturers and other organizations plan their long-term capital spending and facility expansion projects.
Value stream mapping vs. process mapping: what’s the difference?
The key difference between a value stream map and a process map (or a process flow diagram) is that value stream maps help identify waste both between processes and within them.
- VSMs also include key details that process maps leave out, including how information is exchanged throughout the process, whether those exchanges are digital or paper-based and what types of interactions make those exchanges possible (operator-to-operator, operator-to-system, system-to-system or system-to-operator).
- VSMs capture other informational elements which are especially important for manufacturers, such as overall equipment effectiveness (OEE), inventory levels, and wait times.
By layering these insights together, a value stream map gives project teams a more complete, multidimensional picture of how well their process flows (or doesn’t). It shows where bottlenecks are and which manufacturing activities they can consolidate or remove to reduce waste.
Benefits of value stream mapping
If you’ve got a process and want insights, you could benefit from value stream mapping. It’s as simple as that.
Though it’s an especially useful tool to drive efficiencies on the production floor, value stream mapping is transferable to any service area, including packaging, warehousing, quality assurance, and even administrative services. VSM helps to:
Eliminate waste
When you see a process and some of its key metrics laid out in front of you, you’re able to quickly identify opportunities to consolidate, re-assign, and remove unnecessary tasks which may otherwise hide behind “the way you’ve always done it.”
Find process bottlenecks
Where are the holdups in your manufacturing line? What would happen if you removed a redundant review process in your documentation change control procedure? Could you free up valuable time by replacing a phone call with an automated system alert? A robust value stream map can help you answer questions like these, giving you a clear view to a more optimized, streamlined operation that’s positioned for commercial success.
Improve standardization
When the same process is done differently by different operators or at different sites, it impedes the whole operation’s overall performance and prevents you from sharing costly resources, streamlining training processes, and ensuring the reliability of results. The value stream mapping process can help you identify these differences and replace them with streamlined, standardized solutions.
Empower your team
Like all lean tools and processes, the principle behind value stream mapping is all about listening to your team, particularly front-line operators in the case of a manufacturing facility, and trusting them to help you identify small improvements that ladder up to significant time and cost savings over the life of your operation.

Example 1: Value stream mapping finds a 28% increase to manufacturing throughput
The challenge:
To improve their manufacturing efficiencies, a pharmaceutical manufacturer recently sought to document their process steps, handoff points and system transactions.
The role of VSM:
Our VSM team began by collecting relevant process data related to the manufacturer’s existing operations, procedures, information and material flows, which we used to generate current state, product-specific VSMs. Along with on-site observations and input from subject matter experts during brainstorming sessions, these VSMs allowed us to identify bottlenecks, inefficiencies, and other opportunities for process improvements.
Next, we generated future state VSMs which showed how various solutions could reduce both cycle times and inventories. To implement these solutions, we helped our client develop a sitewide OpEx and CapEx strategy, which identified opportunities to share resources, level-load the operator work, and decrease overall lead times. As a result of this effort, this client was able to increase throughput by 28%.
Example 2: Talent acquisition process enhanced and accelerated by value stream mapping
The challenge:
As our international footprint grows, the HR team at CRB recently sought to streamline and standardize our global talent acquisition (TA) process.
The role of VSM:
We generated a VSM map of our end-to-end TA workflow, which allowed us to streamline all relevant activities, specify the players involved, and develop pathways for all artifacts collected, manipulated or transferred across that workflow. The resulting process has helped both our hiring team and potential employees enhance their communications, accelerate execution, and improve customer satisfaction.
Example 3: Value stream mapping lowers inventory levels through strategic process improvements
The challenge:
One recent manufacturing client identified the need to reduce long lead times across their process, from receiving incoming raw materials through testing for release. Their goal was to reduce on-hand inventory, which would allow them to shrink their warehouse and intensify their resource utilization.
The role of VSM:
Our VSM efforts drastically reduced this client’s lead times by challenging their current operating procedures, improving their process cycle times, and identifying potential workload leveling opportunities, to name just a few areas of improvement. As a result, they have reduced their overall lead times from receipt through release by approximately 80% for components and 70% for consumables.

Components
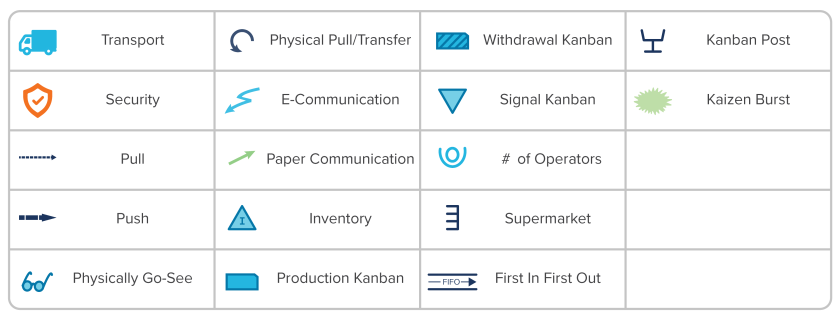
Value stream mapping symbols
A VSM uses industry-standard symbols to visualize every unit operation and information exchange across a specific process. A library of industry-standard symbols is used to visualize end-to-end processes in an accurate, detailed snapshot. Here are some examples of the VSM symbols generally included:
Metrics and insights
Your VSM also captures key metrics and data-driven insights related to those operations and interactions. A manufacturing value stream map may include important metrics and insights based on the goals of your mapping process.
- Cycle times for each unit operation
- Overall equipment effectiveness (OEE)
- Overall lead times
- Waiting times
- Changeover times
- Operator requirements
- Quality requirements/Failure rates (or defects)
- Inventory
How to create a value stream map
Whether you’re mapping a manufacturing process or you’re focused on another industry or functional area, a typical value stream mapping process takes 3 to 5 days. It takes dedication and focus to finish, so it’s best to start and finish without any interruptions.
Some project teams may find a week without interruption unrealistic. In those cases, it’s not unusual to break the process into stages and complete each stage over several weeks.
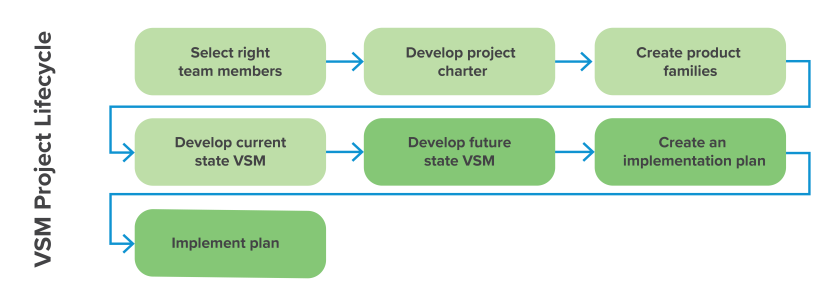
The VSM process is made up of several steps:
Step 1. Select the right team members
A typical VSM team includes approximately 7 to 10 people. It’s important to get the team composition right to maximize the value of this process.
Depending on the type of process under review, that team should include:
- Senior leadership → to help define the objective, demonstrate alignment, and support the team through the VSM process and the implementation of recommended changes.
- Representatives from across the organization who play a role in the process, including supervisors, front-line workers and operators (if applicable), salespeople, etc. → to ensure that your value stream maps are accurate and complete, and to provide valuable input when identifying and solving inefficiencies and bottlenecks.
- Key suppliers (optional) → to get a more holistic understanding of the complete system behind the process.
- A third-party facilitator with VSM experience and expert knowledge of your industry and its regulations → to provide unbiased guidance, build consensus among team members, and ask questions that will help you uncover the root causes behind process challenges.
Step 2. Develop a project charter
It’s vital to clarify the objective of your value stream mapping process before you begin, which will help you steer that process toward a meaningful result. Your project charter will document this objective, as well as other important inputs such as expectations and responsibilities, timelines, and more.
At this stage, an experienced facilitator will also help your team establish the right environment for a productive and results-driven value stream mapping process. That means cultivating a zero-blame culture in which team members are encouraged to speak openly about process issues and contribute ideas and solutions without fear of finger-pointing. It also means committing to an open and honest discussion, with all biases checked at the door.
Step 3. Create product families
Start by defining your product or service families, depending on the process you are examining. This will help you to focus the value stream mapping process and generate solutions that are suitable for specific scenarios.
Each product (or service) family should be based around key similarities. That could mean grouping products that share workflows, that involve the same people, or that rely on the same raw materials, for example.
Each product family can have a unique value stream map, or you may be able to use the same value stream map across all families with a few key tweaks to account for shifting variables from one family to the next.
Step 4. Develop a current state value stream map
Building your current state value stream map involves two main activities:
Map all inputs, outputs, and constraints for each unit operation
In a manufacturing context, for example, your current state value stream map should visualize what happens to your product at each step in the process, which staff are involved, the equipment used, cycle time, wait time, and the type of information exchanged (paper, digital, etc.). You may need to consult different sources to collect the data that’s most relevant to this process, such as:
- Batch records can provide data such as cycle times, failure rates, OEEs, and much more.
- SOPs can provide operator requirements, quality requirements, and more.
- You will also need to “walk the flow” in order to capture a full picture of the process. Speak with operators, use a stopwatch to study time intervals not captured by instrumentation, and look for other inputs that may help you build a more complete value stream map.
Capture key metrics
Choose metrics and insights that ladder up to the objective identified in your charter. For manufacturers, these metrics might include OEEs, lead times, inventory, throughput, and more.
Step 5. Develop a future state value stream map
Initiate a kaizen event (see below) and work as a team to identify the problem areas and potential waste in your current state VSM. If you’re a manufacturer, these may include:
- Low OEEs
- Delayed QA results, which cause a queue to form on the production line
- Too many hand-offs, information exchanges or over-engineered SOPs
- A lack of predictability around downtime
With these problem areas identified, you can begin to brainstorm potential solutions and may also use discrete event simulation (DES) to test those solutions against the constraints and opportunities available. From this process, you will generate your intermediate (attainable) future state VSM, giving your team an “X” on the map toward which to steer their implementation efforts.
You may also develop an ideal (aspirational) future state VSM at this point, which will help all stakeholders understand the “blue sky” option and potentially incorporate its recommendations into future facility planning efforts.
Step 6. Create an implementation plan
In as much detail as possible, list the steps needed to put the future state VSM into action, with notes about timelines and the people responsible. This is a critical step that will help your team generate value from this process and ensure that impactful solutions make their way from the boardroom to the production line.
Step 7. Implement your plan
It is not entirely uncommon for this step to be left out. In order to realize your operational improvements, the plan must be fully implemented.
What is a kaizen event? And why you need one.
Kaizen is a Japanese concept that signifies a positive change. In the context of lean manufacturing, it refers to the notion of “continuous improvement,” or moving steadily toward a better state of operation through incremental adjustments.
A kaizen event is a process in which stakeholders gather to brainstorm strategies that will drive continuous improvement in the face of a particular, well-defined problem. When a manufacturer’s production volume falls short of expectations, for example, they may hold a kaizen event to find the root cause of the problem and develop potential solutions.
What is the purpose of a kaizen event?
The purpose of a kaizen event is to gather cross-functional experts in one place at one time, where they can apply focused pressure on a particular organizational problem in order to solve that problem and improve overall operations.
In the context of value stream mapping, the kaizen event gives team members an opportunity to review the current state VSM and identify bottlenecks, inefficiencies, and opportunities for removing wasted tasks. This work carries forward into the future state VSM.
What are the different kinds of kaizen events?
A point kaizen focuses only on a single point in a larger process or system, such as unplanned downtime for a single piece of equipment on the line.
A line kaizen focuses on an overall process or production line, including all of the unit operations and information exchanges involved in that process. Most value stream mapping processes involve line kaizens.
A system kaizen takes into consideration all functions within a manufacturing facility or other type of organization, helping the VSM team understand the impacts of certain variables on operations that are adjacent to the process. If the VSM is focused on a manufacturing process, for example, a system kaizen will look for the impacts of particular process variables on adjacent operations, such as warehousing or quality assurance.
A cube kaizen goes beyond the system kaizen to consider an entire ecosystem from a holistic perspective, including external factors such as the supply chain network.
How to prepare for a kaizen event
To get the most from your kaizen event in the context of VSM, prepare your current state value stream map ahead of time and use it to find existing problem areas and ideate on potential solutions. This will give you a concrete, unbiased foundation on which to build your strategy for continuous improvement, rather than troubleshooting your operation based on assumptions.
How to conduct a kaizen event
Successful kaizen events don’t just happen—they depend on expert facilitation, a carefully chosen team with clear objectives, and data-backed insights that guide discussion and point the way to clear, meaningful solutions. Key elements of a successful kaizen event include:
- A well-defined goal
- A safe and supportive environment in which to discuss challenges and share opinions
- A tool for visually tracking problem areas in the current state VSM, such as Kaizen burst icons. A kaizen burst is a visual symbol affixed to a VSM, signaling an area of concern or an opportunity for improvement.
How to get the most from your value stream mapping investment
- Get clear about your objective. Knowing what you need from your VSM process will help you capture the right data, identify the most impactful solutions to address key problem areas, and deliver a meaningful return on your investment. For manufacturers, increasing the throughput in a particular facility is an example of a strong VSM objective.
- Start small. One of the best ways to generate internal support is to focus on small, meaningful “wins” from day one. That could be as simple as removing a step from an administrative process, calculating the cumulative time saved over the course of a year as a result, and communicating that result to those impacted by it. These incremental changes can add up to significant ROI in as little as a week following their implementation, and they help teams feel empowered and excited about the possibilities of value stream mapping.
- Involve the right people. Having the buy-in and participation of senior leaders as well as input from different functions across the organization is the key to a balanced, successful value stream mapping process. This is a collective effort—done well, it will generate collective success.
- Apply the principles of good change management. In the rare instance that you’re not seeing an immediate return, examine your downstream support. To avoid this outcome, think of this not as a one-off process but rather as the beginning of a meaningful series of changes that will take time, expertise, and a strong implementation plan to pay off.
- Rely on an experienced VSM facilitator. A third-party facilitator who understands the value stream mapping process and its relevance within the context of your specific industry is key, whether you’re a manufacturer or another type of organization. Your facilitator can use their experience to guide your team through the process, and their external perspective may help you to see problem areas and opportunities that may not stand out to internal stakeholders.
Elevate your data and insights
You can further understand the impacts of your potential changes with dynamic value stream mapping by pairing discrete event simulations (DES) with your VSM. DES is a computational technique for modeling “what-if” scenarios and understanding the impact of certain changes on a system over time. It’s especially useful when it comes to characterizing dependencies, uncertainties or variability, and it helps manufacturers ready their operation for unexpected changes. These qualities make it a popular tool for de-risking manufacturing supply chain networks or finding opportunities to increase revenue at a particular facility.
In the VSM context, DES allows project teams to understand the dependencies related to each variable in a process. This means you can simulate your future state VSM to observe its impact on cycle times, changeovers, failure rates, and other important factors. You can see if your future state VSM helps you achieve your goals or just shifts the problem elsewhere.

Example 4: How value stream mapping helped a biotech innovator cut documentation turnaround time by nearly 90%
The challenge:
With sites located in both the USA and Europe and a rapidly expanding pipeline of therapies in development, this biotech manufacturing company faced escalating complexity in their documentation change control process. Different sites were handling that complexity in different ways, causing a high level of variability in change control lead times and ultimately impacting their downstream speed to market.
The solution:
A lean and standardized documentation control process could significantly reduce change control lead times across all three sites. To get there, we followed these steps:
1. We developed current state VSMs.
Using system time stamps and estimates of hands-on time, we created three value stream maps representing this client’s change control process, one for each of three document types: Batch Production Records (BPRs), Solution Lot Records (SLRs), and Standard Operating Procedures (SOPs).
2. We held a kaizen event to develop future state VSMs.
With input from across their organization, we helped this client use kaizen bursts to flag bottlenecks in their current state VSMs.
With these kaizen bursts as focal points, we generated four future state VSM maps:
- Three intermediate future state VSMs (one for each document type). These VSMs gave our client an objective to pursue in the near future within the constraints of their current IT system.
- One ideal future state VSM (representing the overall operation for all document types). This VSM envisions the impact of implementing an all-new IT system. Given cost constraints, this ideal future state was deemed out of reach.
Key changes between current and future states include:
- Updating procedures and workflows to correspond with differentiated levels of change control complexity (from low to high)
- Shifting certain activities upstream
- Defining expectations on turnaround times
- Establishing adequate training protocol
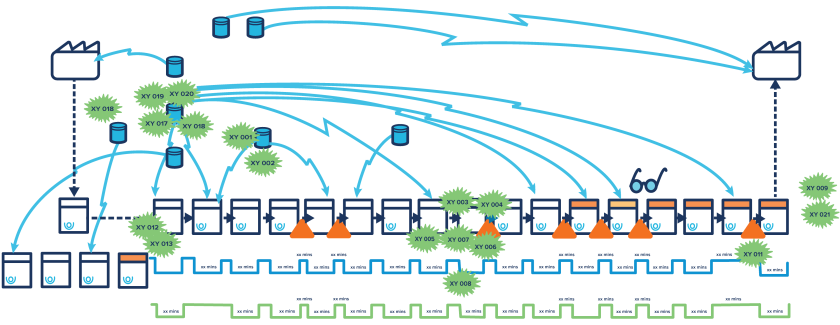
Example of the current state value stream map
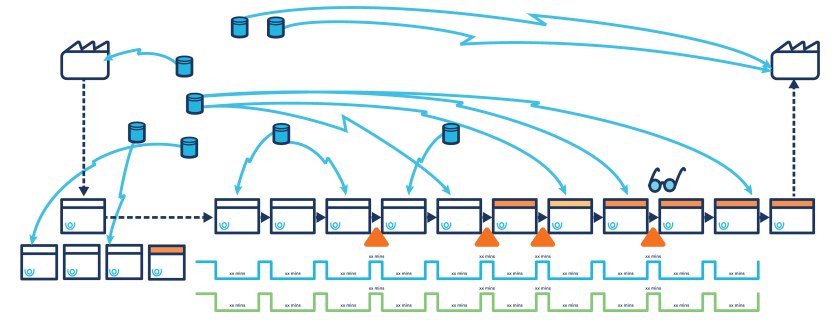
Example of the intermediate future state value stream map
3. We developed a detailed implementation plan.
We helped the client create a clear plan to see quick and measurable results from their VSM investment. The plan lays out a four-month runway from drafting initial documents to implementing procedural updates.
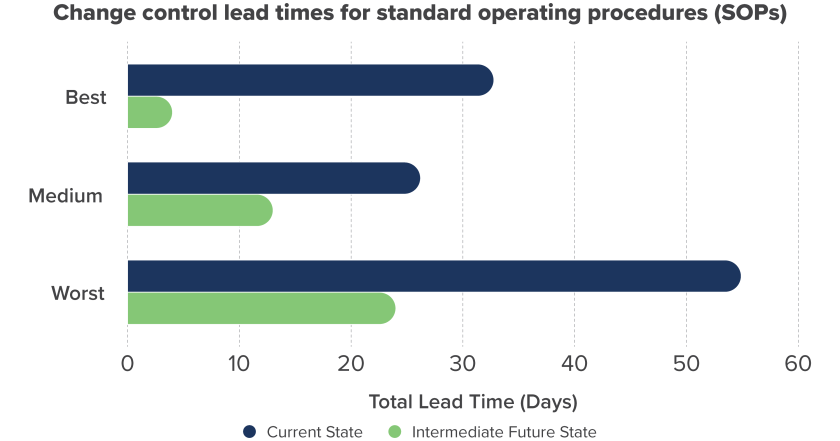
The results:
Our calculations show that by implementing the intermediate future state VSMs, this client could reduce their change control lead times by 50% to 90%, depending on the site, the document type, and the complexity of change.
When should you create a value stream map?
The short answer: now!
Your existing process could benefit from VSM at any time, but it’s especially important when you see clear indications of an inefficient workflow. Maybe you’re a manufacturer with too much unplanned downtime, too much inventory sitting idle, or too much foot traffic moving through your facility. Value stream mapping can quickly address these problems and other inefficiencies which may remain hidden until you see the whole process.
Value stream mapping is also useful when you’re planning a new process, expanding or remodeling an existing process, or building a new manufacturing facility. You can use your initial process assumptions to develop a baseline value stream map before you begin, which will help you avoid surprises and costly design remediations down the line.
How to get started?
If you’re ready to improve your manufacturing processes or other areas of your organization, or if you’d like more insight into how VSM can help you apply lean principles to your operation, let’s talk. Contact our team of VSM consultants today.
Frequently asked questions: Value stream mapping
VSMs use visual diagrams to identify areas within a given process that can be improved, challenging the status quo. The diagram uses a standardized key to capture time, tasks and communications within the workflow to quickly identify low-hanging fruit for process improvements and fast ROI. VSMs are widely used in manufacturing, but are also applied to finance, healthcare, supply chain logistics and many other industries to drive continuous improvement.
The typical VSM process can take as few as 3 to 5 days, including an interactive session where you walk through the actual workflow process.
There are many great use-case examples for VSMs, including identifying longer, manual communication tasks that could be replaced with a quick automated alert to reduce process times, or a VSM could be used to reduce material lead times, resulting in lower on-hand inventory levels for a smaller warehouse. VSMs can be used to increase bottled beverage throughput, reduce redundant steps in the hiring process, or cut documentation time in half to reduce labor hours.
A current state value stream map is a visual outline of how your process currently works, which is used to identify tasks, times and exchanges for efficiency improvements. It maps all inputs, outputs, and constraints for each unit operation and your key metrics.
A VSM captures additional information, including how information is exchanged throughout the process, i.e., digital or paper-based, and which entities are involved, like operator-to-operator, operator-to-system, system-to-system or system-to-operator. The VSM also captures inventory levels, waiting times and pinch points.

Where to find your food manufacturing efficiencies to save OpEx9 tips on food manufacturing efficiency from industry experts to help you fine-tune operations, maximize your assets, and save money.
Read More
9 tips on food manufacturing efficiency from industry experts to help you fine-tune operations, maximize your assets, and save money.
Read More