
Simple CFD adjustments can fix poor gas holdup, bubble size distribution, surface tension, and low volumetric mass transfer to improve bioreactor efficiency, cell culture productivity, and profitability
Read More
Validating a biopharma cleanroom with airflow visualizations is critical for ensuring product safety, quality, and regulatory compliance with Annex 1. The validation processes ensure proper air filtration, desired air flow patterns, pressure differentials, and environmental controls to prevent contamination. But waiting until your cleanroom has been constructed for a smoke test puts you at risk of late-stage design changes and costly modifications. Simulated airflow visualizations present another path. Computational Fluid Dynamics (CFD) is being used throughout the industry to support and bring confidence to cleanroom HVAC designs well before the design is complete or CapEx is invested.
Per the updated 2022 release, Annex 1 calls out airflow visualizations in section 4.15:
“Airflow patterns within cleanrooms and zones should be visualised to demonstrate that there is no ingress from lower grade to higher grade areas and that air does not travel from less clean areas (such as the floor) or over operators or equipment that may transfer contaminant to the higher grade areas.”
CFD is the study of fluid mechanics that uses the governing equations of conservation of mass, momentum, and energy to simulate and solve problems involving the flow of air, liquids and gases. It allows engineers to accurately model the pressure, velocity, temperature, species dispersion, and behavior of fluids to predict how they will interact with surfaces and within complex environments.
Simulated airflow visualizations supporting design and testing
While these simulations are similar to a smoke test, the data and visuals from a CFD study provide the engineers and project teams with much more insight. For instance, the 3D visualizations from CFD allow us to examine the flow pathlines in far greater detail than what a smoke test could offer. The advantage is that computational simulations can help you validate your design ahead of construction, allowing you to virtually modify and optimize the design until desirable results that meet the regulatory requirements are achieved.
For example, one project’s base case design showed a higher acceleration of flow closer to the return air chase openings. The opening size was increased from 12” to 18” in the model to reduce the acceleration as it would dissipate less energy for recirculation in Grade B space. Simulation results were able to inform the final design.
More specifically, simulations can be used to support cleanroom and HVAC design through:
- Qualitative visualizations
- Identifying unidirectional flow of “first air” for Grade A
- Identifying airflow turbulence and recirculation zones
- Finding “dead spots”
- Identifying age of air
- Quantify the change in flow direction and a flow deviation index
- Providing velocity data
- Providing discrete particle models
Vertical components of the flow field in Grade A space can be visualized and calculated to understand the unidirectionality of the flow field. 3D velocity vector plots and pathlines offer animations viewable from any angle for improved visualization within the cleanroom.
Beyond HVAC validation, optimization, efficiency and cost savings, these cleanroom CFD models can also support regulatory compliance by providing detailed documentation of airflow patterns and contamination control measures. And you can revisit cleanroom CFD models down the road when new equipment is being introduced to the space.
HVAC Design Validation for unidirectional flow
CFD simulates airflow patterns in cleanrooms to ensure air moves in a way that minimizes contamination risks, crucial for maintaining the stringent cleanliness standards in Grade A and B areas where sterile products are handled. HVAC design can be validated by quantitative and qualitative analysis of flow patterns, particle distribution, and age of air.
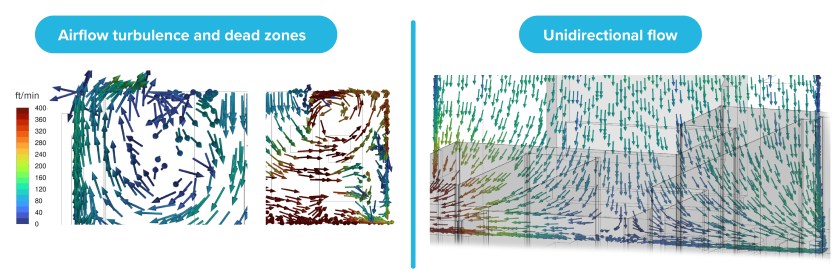
Unidirectional flow directs air in one direction, usually from ceiling to floor, without causing turbulence. This continuous movement helps eliminate particles and contaminants from critical areas, preventing them from settling on surfaces or products. This is essential for processes that require a high level of sterility, such as aseptic filling and packaging. Without this controlled airflow, particles and contaminants can accumulate, potentially compromising the sterility of pharmaceutical products and posing serious health risks to patients. ISO 5/Grade A cleanrooms must meet stringent regulatory standards. Unidirectional laminar flow is a key requirement to achieve the necessary levels of cleanliness and to comply with GMP guidelines.
CFD cleanroom airflow visualizations in action
A vaccine manufacturing client was expanding an existing fill room to add a new lyophilizer. The design team wanted to validate the HVAC design for unidirectionality in Grade A space when the lyophilizer door was open and the lyophilizer cart was present. Our CFD specialists were leveraged to model the scenario during the design stage to ensure HVAC design met unidirectional flow conditions and that only first air contacted the top of the cart while the lyophilizer door was open.
Identifying your flow deviation index
When using a CFD analysis for an airflow study, the simulation generates velocity data that can be used to quantify the first air’s directionality. Along with the qualitative visualization of the path lines, CFD simulations can quantify the change in flow direction as it gets closer to the fill line equipment. If the flow deviation index shows that the horizontal flow starts to dominate the vertical component well before the first air meets the fill line surface, we would need to improve the HVAC design, e.g., increasing supply air velocity.
DPM (discrete particle model)
Cleanrooms have numerous contamination sources, including:
- People introduce contaminants through skin dander, clothes, from breathing and talking
- Materials brought into the facility
- Shedding, chipping, breaking of building surface finishes
- Abrasion, chipping, breaking and shedding of metal or non-metal
- Containers, machinery and tools
- Opening & closing of internal & external doors
- Make-up air and air leaks
- And other operations, e.g., equipment operation, writing, walking, etc.
Among these sources of contaminants, the presence of people/operators in the cleanroom during the operation is the leading source of contamination in terms of particle shedding and microbial sources. A typical CFD analysis for Grade A/ B space includes flow profiles, pathlines, flow directionality, and age of air visualization. Additional analysis can be performed using discrete particle model to understand the movement of particles/ contaminants released from the source. The trajectory of the particles allows for understanding of how long it takes to remove a contaminant from its origin within the 3-dimensional cleanroom and the locations of potential accumulation.
The discrete particle model can help resize the HVAC design to increase or decrease air changes per hour depending on the time spent by particles within the cleanroom. This can help eliminate shortcomings of an HVAC design. On the other hand, it can indicate if the cleanroom HVAC is overdesigned based on the total air flow rate or air changes per hour—in which case major CapEx and annual OpEx can be saved.
HVAC design optimization
Cleanroom design involves various constraints like the location of supply HEPAs, return air chase, exhaust, windows, doors, number of operators, carts, and lyophilizers. These constraints might prevent the base design from meeting air quality standards. However, design optimization through multiple iterations can achieve an HVAC design that meets requirements.
CASE STUDY: Cleanroom HVAC validation and optimization study
During the expansion design of a 6,000-square-foot facility with Grade A – D spaces, CRB’s CFD engineers were brought in to validate a proposed cleanroom HVAC design to avoid costly post-smoke study modification. The client needed to ensure the unidirectional airflow would meet regulatory guidelines for this Grade A (ISO 5) and Grade B (ISO 7) space. Due to floor design constraints, this project’s fill line cleanroom had a non-uniform and semi-continuous distribution of low-wall returns, which could potentially lead to higher lateral flow and negatively impact the unidirectionality of airflow.
The mission for this cleanroom airflow simulation:
- Identify regions of concern, like dead zones where air is not being changed and areas of potential particle holdup
- Reduce airflow turbulence
The CFD cleanroom airflow visualizations and analysis were needed to test the air change effectiveness, efficiency and the mean age of air. The models were derived from 3D CAD models to capture fill line, equipment, autoclaves, carts, and even MAL and PAL door details.
This study found the base case design had a high risk of particle contamination, but using the model, our team was able to find an improved design to reduce that risk and increase cleanliness and product quality. Proposed design changes included low wall return sizing and placement, modification to the quantity and placement of HEPAs in Grade B, and the elimination of a corner in Grade B space that had relatively lower air changes per hour with the potential for particle accumulation. On average, the air change rate was improved, lending itself to increased uniformity and unidirectional flow.

Using simulations for Grade C and D spaces
Using simulations for Grade C/D spaces in pharmaceutical manufacturing can help optimize the environment for less critical operations. CFD can be utilized to simulate and analyze airflow patterns, ensuring effective air distribution to maintain cleanliness levels and minimize particle accumulation in cleanrooms. This is vital for reducing risks and preventing contamination in areas where processes are less stringent but still important. Using CFD to document and validate airflow and contamination control measures aids in meeting regulatory standards for these grades, which is essential for compliance with GMP guidelines.
There is also the sustainability component; CFD can optimize the design of ventilation systems to ensure they are energy-efficient while still meeting the cleanliness standards of Grade C (ISO 7) and Grade D (ISO 8) spaces.
Simulations support efficiency and cost savings when designing cleanrooms
Simulations can identify potential issues before the cleanroom is built or expanded, reducing the need for costly modifications and delays to your project’s operational readiness. It also helps optimize the design for energy efficiency, leading to significant cost savings over time.
If you’re ready to integrate HVAC and cleanroom testing earlier in the process, our team of experts can help. Reach out today.

Improving ATMP manufacturing facilities’ function and operating experience with wayfindingRevolutionize ATMP facilities with wayfinding: how to optimize layouts and enhance operator experiences
Read More
Revolutionize ATMP facilities with wayfinding: how to optimize layouts and enhance operator experiences
Read More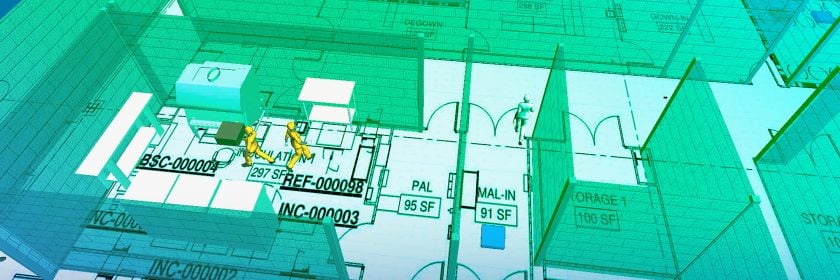
A guide of modeling and simulations for manufacturing projectsA comprehensive overview on how modeling and simulation can be leveraged to improve operations and meet business targets
Read More
A comprehensive overview on how modeling and simulation can be leveraged to improve operations and meet business targets
Read More