When a pharmaceutical start-up with a promising therapeutic begins to plan for commercial scale-up, you might expect to see well-established industry approaches within its processes. Our client had a very different vision: semi-continuous processing.
Unlike the large pharma facilities typical of batch processing, this pharma team aimed to reduce CAPEX by keeping their footprint small. At the same time, they wanted to control their OPEX by leveraging stainless steel equipment, which would shrink their consumables spending and reduce their labor overhead. Completing this vision was our client’s ambitious production target as their aim was large-scale, commercial manufacturing.
This left our project delivery team with an interesting challenge. We needed to design a smaller-scale commercial facility capable of high production volumes, and we needed to do it without relying on the usual tools that help to shrink a facility’s footprint, like single-use systems.
To meet this challenge, we developed a novel approach that would meet three main manufacturing goals:
- Reduce capital expenditures by harnessing semi-continuous manufacturing, thereby dramatically shrinking our client’s facility and equipment footprint.
- Reduce operating costs by leveraging highly automated manufacturing equipment.
- Reduce material costs with a centralized system of small-scale, stainless steel buffer tanks, supported by automated top-ups and connected to the manufacturing process through a network of distribution lines.
Process intensification, be it semi-continuous processing or methods like continuous chromatography, provides a wide range of benefits to biopharma manufacturers. This is the story of how we leveraged modeling and simulations to meet our client’s objectives, and what we did to deliver an optimized and intensified commercial production design for a pharma pioneer.
Key questions for a semi-continuous process
Between receiving raw components and releasing a finished product, this client’s process involves over 100 hours and up to 40-unit operations, using over 30 buffers along the way. That’s not accounting for supporting functions, like the cleaning and maintenance protocols that are vital to ensuring a high level of safety and product quality.
To make this novel operation work at peak capacity, our team needed to answer key questions on processing size, uptime and risk management.
- Processing size: What volume of starting material can this client semi-continuously process into a single final lot, while allowing for appropriate cleaning and maintenance activities?
- Semi-continuous: Starting material volume that is then continuously manufactured to achieve a final product lot.
- Uptime: How can this client schedule those cleaning and maintenance activities to maximize equipment uptime?
- Risk Management: What degree of redundancy is required to ensure all necessary materials and equipment are semi-continuously available?
Before answering these questions, our team of process experts needed a low-risk way to test and evaluate the interdependent variables impacting this client’s process. For that, we turned to our team of Modeling and Simulation experts.

Leveraging modeling and simulation to find manufacturing solutions
We started by building a simulation model.
Our first step was to build a computational twin of this client’s manufacturing process, giving us an environment in which to observe the outcome of complex simulations. This involved four core steps:
1. We gathered the necessary data.
Because we co-developed this client’s process alongside their R&D team, we could feed precise and customized mass balance calculations into our model, rather than estimating performance times based on historical data.
2. We built the backbone of the model.
With that data at our fingertips, we began building time for the process’s main contact steps into the model. These steps included core operations like loading the chromatography column or filtering the product. At this stage, we were focused on establishing the “big picture” process.
3. We layered in the granular details.
Once the process’s main operations were in place, we began to add supporting functions, like setup, cleaning and sanitization, as well as raw materials and consumables usage. The model became more detailed at this stage, reflecting variables such as the time and materials required for equipment sanitization.
4. We added the facility-wide utilities system.
To get a full picture of the interplay between process operations and supporting functions, we layered essential details such as the Water for Injection (WFI) and buffer system’s schedule into the model as a final step.
Next, we used the model to analyze manufacturing scenarios.
Now that we had a computational environment to stand in for the real-world pharmaceutical facility, we could accurately simulate a full production cycle for potential processing sizes, anything from 4,000L to 10,000L.
This helped us to understand the relationships between processing sizes, processing times, and equipment occupancies, and the impact of those variables on cleaning and maintenance activities.
As we ran these simulations, we were particularly attuned to the interplay between three key production factors:
White space
These “blank” intervals in the process schedule represent periods when no action is underway.
In a well-planned manufacturing process, white spaces have a job to do: they might create an opportunity for cleaning or maintenance, or they might act as a “shock absorber” in the event of an upstream delay.
As we ran our simulations, we studied how different processing sizes expanded or reduced these white spaces. For example, a 4,000L processing volume might leave a 10-hour window for cleaning and sanitation activities, while a 7,000L volume might leave only 4 hours—too little to accommodate cleaning. The better we understood these variables, the more we were able to balance productivity with an appropriate risk management strategy.
Forced downtime
In addition to studying white space as a natural outcome of individual process steps, we simulated random events that would force downtime within the equipment itself. This helped us to understand how long it would take the process to normalize, should such an event be required.
Redundancies
Many of the unit operations in this continuous process overlap, demanding a lot from equipment that must also be regularly cleaned and sanitized.
Forcing downtime on the schedule to accommodate cleaning and sanitization would impact this client’s production rate; the only alternative was to design appropriate redundancies into the system. This could involve a second buffer tank to stand in while the principal tank undergoes cleaning, as well as redundant water for injection (WFI) distribution systems to allow for sanitization. Tanks storing frequently used buffers might also require redundant distribution lines.
Right-sizing those redundant systems for a manufacturing process as complex as this one was a big task. Too little redundancy would delay operations; more redundancy than necessary would lead to unnecessary costs. We relied on our simulations to help us find a middle ground where our client would have the redundancies they needed, exactly when they needed them—no more, no less.
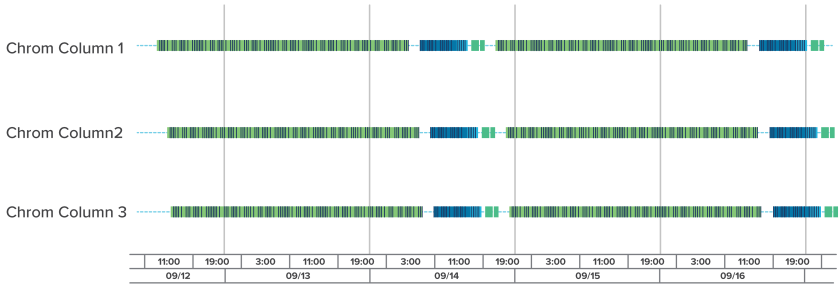
Equipment occupancy chart
Using our SchedulePro model, our process specialists can visualize how contact-specific operations line up with supporting services. Running simulated production cycles through models like this one helps us to uncover opportunities to improve capacity and manage risks
The twist: Our client’s idea was to add a second production suite, one that would pull raw materials from the same central buffer system as the first suite and would share many of the same utilities already scoped in our model.
Duplicating the production suite created a new series of challenges. First, it eliminated the white space we’d designed into the process; if the buffer system had to work double-time to feed two suites instead of one, for example, when would it be cleaned?
There were two obvious solutions to this: either impose downtime on the schedule to accommodate cleaning and maintenance, or add a full second set of redundancies. Both were costly.
The “A-HA” moment: Our original redundancy strategy was based on dedicated systems—for example, every buffer would have two dedicated tanks, a principal tank and a redundant one. But the redundant tank is only used while the principal undergoes a cleaning or maintenance protocol. Otherwise, it’s an idle piece of equipment.
That got us thinking: Could we overlap operations so that both suites could share redundancies?
Using our process model, we tested and tweaked this approach until it functioned seamlessly, sparing our client from the expense of a whole new support system while allowing them the increased capacity of a whole new suite.
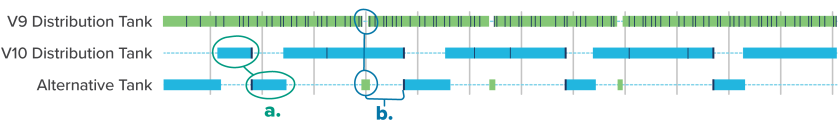
A. To clean the main at-use hold tank, an alternative tank is used; B. There is enough time to clean the redundant tank between holding the two different buffers.
The second suite doubled our client’s potential capacity for a very manageable cost, significantly raising the value of their investment and readying them to grow their portfolio of sought-after therapeutics in the future.
Using simulations to solve problems
Our SchedulePro model and the discrete simulations we performed made this outcome possible. By creating a computational environment in which we could pull levers and test variables within our client’s process, we were able to find opportunities to reduce their capital spending, their operational costs, and their raw material costs.
Interested in exploring semi-continuous or other process intensification options for your operations? Our team of process simulation experts are ready to help.