
How biotech is optimizing autologous cell therapy manufacturing with DES
Accounting for variability
While autologous cell therapy offers new hope for patients, it is also replete with operational variability challenges for manufacturers. With cells that come from the patient and return to that same patient over a very short period of time, supply chain, scheduling and resource availability create escalating layers of unknowns. Discrete event simulation (DES) models are tools for autologous cell therapy manufacturers to combat these challenges and assess how variability impacts operations to mitigate risk, right-size resources, and increase capacity.
Autologous cell therapies: a unique source with unique challenges
Autologous cell therapy manufacturing starts by collecting cells from the patient at a medical clinic, shipping those cells to a manufacturing facility for ex-vivo processing, then shipping those newly modified cells back to a medical clinic for administration into the same patient—all within a few days’ time. This sensitive, multi-step process presents multiple risks and challenges. One such challenge autologous cell therapy manufacturers face is an inconsistent apheresis delivery schedule, which is dictated by medical clinics’ collection schedule and the need for transportation. Both present multiple possibilities for delay within this time-sensitive process. Incorporating resource variabilities, like these, into the manufacturing facility’s design and operational strategy can help decrease lead times and reduce operating expenses.
Another facet of autologous therapies that adds unique challenges is the fact that they use and return cells derived from the patient themselves. With the personalized nature comes the potential risk for mix-ups. Maintaining the chain-of-identity (COI) and chain-of-custody (COC) is critical, and loss of control can directly impact patient safety. Additionally, because every patient batch is unique, autologous therapies cannot be mass-produced. This can cause disruptions in what might otherwise be a steady-state operation. And to the patient, every day and every delay counts in this vein-to-vein process.
Using DES to address manufacturing challenges in autologous cell therapy
While spreadsheets and whiteboards can provide a deterministic perspective, DES models are uniquely poised to illustrate, analyze, and assess future challenges to provide actionable insights. DES models incorporate variability, which is their primary differentiator from typical spreadsheet calculations. Furthermore, the ability to map historical data and data-sparse environments to a statistical distribution creates a more accurate representation of reality than using minimum, average, or maximum summary metrics for calculations.
Simulation modeling is also a useful tool for experimentation. The ease with which users can perform “what-if” analysis makes DES models highly valuable for companies undergoing rapid growth or significant change. For example, companies transitioning from clinical to commercial-scale manufacturing can find tremendous value in leveraging DES to visualize, understand, and analyze operations.
Here we will explore how simulation models can be used to address these two cell therapy manufacturing challenges:
- How does variability in apheresis delivery impact facility throughput capacity for autologous cell therapy manufacturing?
- How does a manufacturer determine the right amount of equipment to meet demand when working with time-sensitive batches?
Assessing throughput capacity under varying apheresis delivery schedules
To underscore the importance of this topic, let’s start with an example. The chart shows the probability of apheresis receipt per day of the week for each scenario.
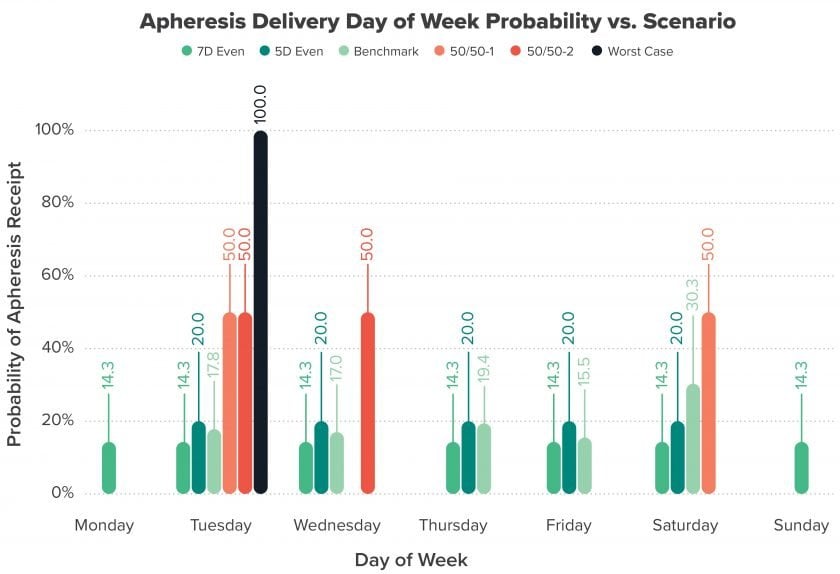
Figure 1. The distribution of apheresis receipt can vary widely. The above distributions are chosen to illustrate how each impacts throughput capacity. In practice, CRB leverages data to develop the most accurate representation of operations.
Assumptions
- Apheresis collection occurs Monday-Friday. Therefore, delivery to manufacturing facility can only occur Tuesday-Saturday (excludes Scenario 1 below).
- Expansion time is probabilistic with the following distribution:
- 4 days = 60% | 5 days = 15% | 6 days = 5% | 7 days = 20%
- Changeover time for cell processing equipment takes 24 hours.
Process constraints
- Incoming apheresis cannot be held more than 24 hours before beginning the manufacturing process. All batches held beyond this time are considered invalid and therefore reduce facility capacity.
Scenarios
The following scenarios were modeled to assess how apheresis receipt day of week distribution impacts wait time for resources and, therefore, throughput capacity.
- 7D Even: Even distribution across 7 days
- 5D Even: Even distribution across 5 days
- Benchmark: Distribution pulled from historical information
- 50/50-1: 2 Days Only (50/50 Split) – Spread
- 50/50-2: 2 Days Only (50/50 Split) – Consecutive
- Worst Case: 1 Day Only
Case Study
Our consulting team modeled operations in simulation software to replicate the acquisition, changeover, and release of the fully automated cell processing equipment. Input parameters and scenarios were plugged into the simulation model to develop the following performance metrics.
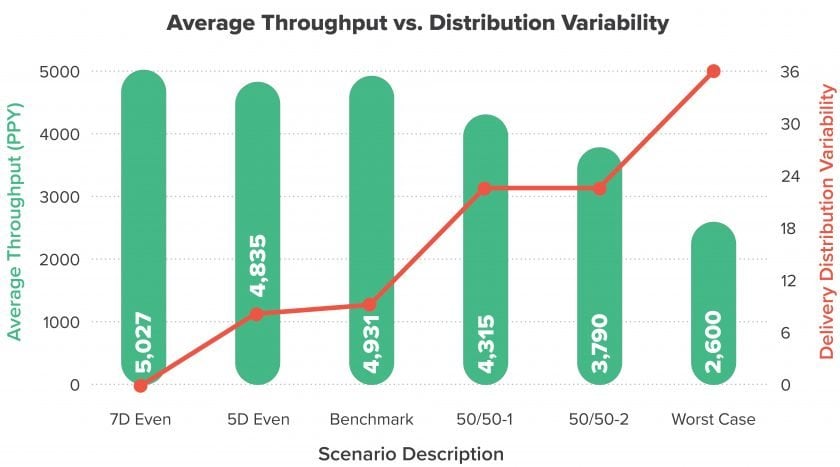
Figure 2. Apheresis receipt schedule has a large impact on facility throughput capacity when lead time limitations exist. More delivery variability (demand for resources) means fewer batches can be accommodated.
Figure 2 shows the throughput achieved for each scenario along with the delivery distribution variability of the various apheresis receipt/day-of-week distributions.
As a general trend, throughput decreases as the variability across the days of the week increases. For example, the scenario in which the probability of apheresis receipt was equal across all seven days of the week produced the maximum throughput. The predictability of the incoming sample demands allows the manufacturer to level-load the equipment demands and therefore minimizes the number of batches that are not completed in the given timeframe due to excessive wait time. In contrast, assuming the same amount of equipment, a worst-case scenario wherein all batches are received on a single day of the week produces the highest resource demand peaks and the lowest throughput capacity.
Further illustrating the significance of apheresis receipt timing, comparing the 50/50-1 and 50/50-2 scenarios shows a drastic difference in facility capacity. While both scenarios have equal distribution variability, it’s clear that having the receiving days back-to-back causes significant reductions in throughput capacity.
The example above illustrates how apheresis delivery schedule impacts throughput capacity assuming a constant quantity of resources (equipment and staff). However, we are not limited to just experiment with one variable. A similar assessment can help us understand throughput vs. cell processing equipment quantity or how staffing may constrain throughput.
For example, we may believe that a simple solution to increase capacity is adding more equipment and staff. However, resources might be drastically underutilized during times of low demand and infrequent apheresis delivery, and not to mention the impact this may have on the overall cost of goods. Performing scenario analysis helps find the right balance between effectiveness and efficiency.
Determining equipment quantity for anticipated demand
A past cell therapy client recently returned to CRB for help determining the number of controlled rate freezers (CRFs) needed to support anticipated annual throughput at a certain assumed utilization. Our consulting team’s knowledge of the autologous cell therapy manufacturing process and the client’s existing environment provided the insight to immediately recognize the request had a flaw.
In most industries, utilization dictates how many pieces of equipment a manufacturing process needs. Utilization (for CRFs) equals occupancy over availability. In these situations, we might set the maximum utilization at 75% to allow for maintenance or downtime activities. If utilization exceeds 75%, you introduce another piece of equipment to provide proper utilization.
However, that typical utilization equation does not account for the extreme time sensitivities of autologous therapies. Because there are strict limitations on how long a batch can wait between processes and for the next piece of equipment, the quantity of CRFs should not be based on the average duration of occupancy; it needs to be sensitive to a larger number of requests at the same time.
We used a dynamic simulation model to help the client understand those peaks, and account for simultaneous equipment needs, to determine the appropriate quantity of CRFs to support the anticipated annual manufacturing demand.
CRF time sensitivity analysis:
Our team of consultants ran simulations to represent 10 years of operations to identify the percent of batches that violate established time sensitivity constraints. The model allowed us to vary quantities of CRFs and quantify the percentage of violating batches for each set of CRF quantity. This one-week study allowed the client to make a data-driven decision on the appropriate quantity of CRFs needed based on the risk of lost batches to the capital budget of acquiring additional equipment.
Ultimately, a main challenge of autologous cell therapy manufacturing is that it’s filled with operational variability, and the first source of these uncertainties occurs before the patient batch even starts the manufacturing process. But using DES allows us to assess this variability and understand how it impacts future operations. This gives manufacturers the ability to make informed decisions about what measures to take to improve operational efficiency, increase capacity, and help meet patient needs. Let our consultants help you determine how to maximize your throughput in the face of significant variability.
How can you improve your autologous cell therapy manufacturing? Let’s take a look.

Nicholas DelRe
About the DES expert
Nicholas is an Industrial Engineer focused on improving manufacturing and supply chain operations. He is Lean Six Sigma Green Belt certified with extensive experience using Lean Six Sigma tools to help increase profitability and reduce waste within various systems. Nicholas draws on engineering and economics to guide companies through informed, data-driven project decisions.
Get in touch with Nicholas.